The Pitch Counts The Best And Worst Hitters Swing On
All hitters approach the plate differently depending on where they sit in the count. But great hitters and poor hitters differ in how often they swing in certain situations. Using TAv as a measurement, Baseball Prospectus based on where they sat in the count.
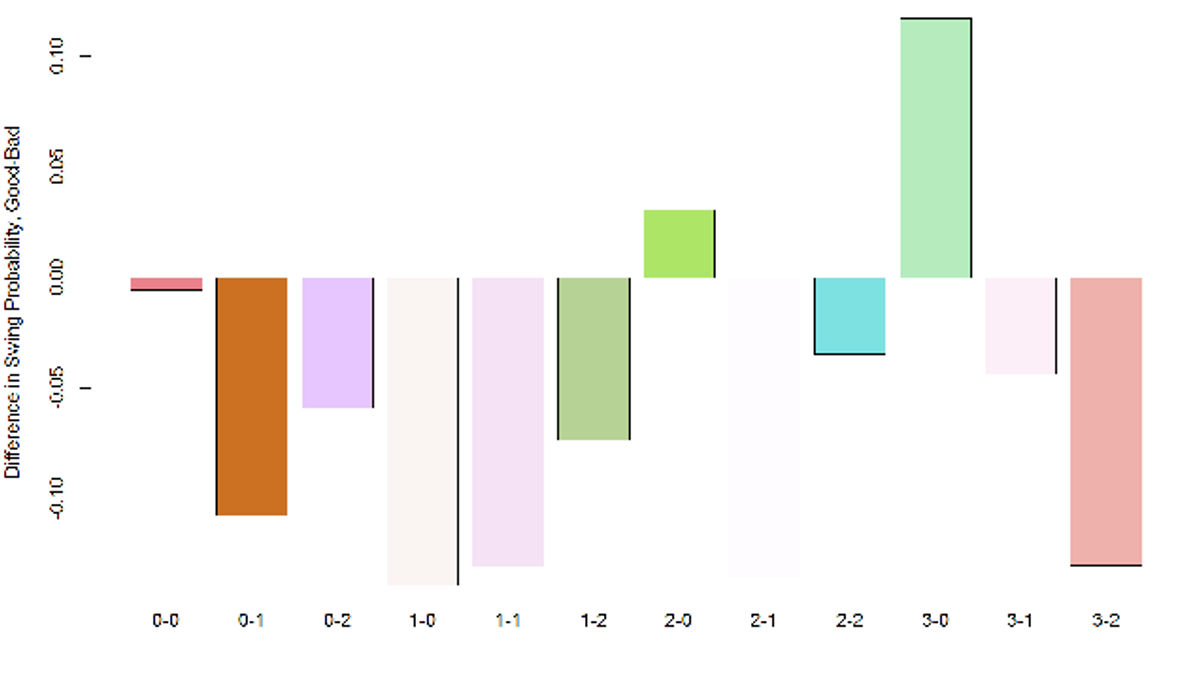
In the above chart, bars above 0.00 are where the best hitters swing more often than the worst hitters. Bars below 0.00 are where the worst hitters swing more often.
As you see, the worst hitters swing more often the majority of the time. The best hitters only swing more often than the worst hitters in 2-0 and 3-0 counts. Given that coaches likely advise their worst hitters to hold in these situations hoping for a walk, it makes sense that the best hitters are more likely to swing away and take a risk at driving a pitch (rather than waiting for a walk) when they are significantly ahead in the count.
While this chart implies that good hitters generally swing less often than bad ones, there's more at play here than just plate discipline. As the article points out, good hitters see pitches that are further from the heart of the strike zone. Pitchers are more likely to challenge the worst hitters and give them something to swing at on those counts. The elevated amounts of swinging seen in the worst hitters may have as much to do with how they're pitched to as it does their plate approach.


- Tuesday MLB Best Bets: June 9th Pitcher Props Worth Targeting
- NBA Finals Game 2 Betting Picks and Predictions Spurs vs. Knicks
- MLB Picks Today: Two Sunday Bets Worth Backing
- MLB Predictions and Best Bets for Saturday's Biggest Games
- UFC Vegas 118 Betting Picks: Three Fights to Target on Saturday Night
- MLB Picks Today: Two Pitchers Set Up To Fall Short On Outs Props
- MLB Pitcher Props Today: Best Bets for June 3rd